scipy.special.logit#
- scipy.special.logit(x, out=None) = <ufunc 'logit'>#
Logit ufunc für ndarrays.
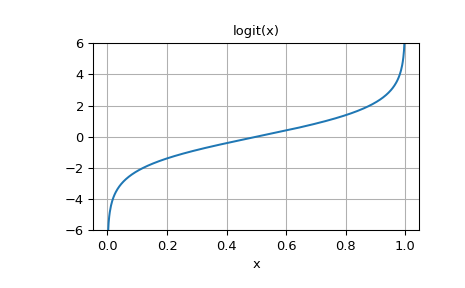
Die Logit-Funktion ist definiert als logit(p) = log(p/(1-p)). Beachten Sie, dass logit(0) = -inf, logit(1) = inf und logit(p) für p<0 oder p>1 nan ergibt.
- Parameter:
- xndarray
Das ndarray, auf das logit elementweise angewendet werden soll.
- outndarray, optional
Optionales Ausgabe-Array für die Funktionsergebnisse
- Rückgabe:
- skalar oder ndarray
Ein ndarray mit der gleichen Form wie x. Seine Einträge sind logit des entsprechenden Eintrags von x.
Siehe auch
Hinweise
Als ufunc nimmt logit eine Reihe optionaler Schlüsselwortargumente entgegen. Weitere Informationen finden Sie unter ufuncs
Hinzugefügt in Version 0.10.0.
logithat experimentelle Unterstützung für Backends, die mit dem Python Array API Standard kompatibel sind, zusätzlich zu NumPy. Bitte erwägen Sie, diese Funktionen zu testen, indem Sie die UmgebungsvariableSCIPY_ARRAY_API=1setzen und CuPy-, PyTorch-, JAX- oder Dask-Arrays als Array-Argumente bereitstellen. Die folgenden Kombinationen von Backend und Gerät (oder anderer Fähigkeit) werden unterstützt.Bibliothek
CPU
GPU
NumPy
✅
n/a
CuPy
n/a
✅
PyTorch
✅
✅
JAX
✅
✅
Dask
✅
n/a
Siehe Unterstützung für den Array API Standard für weitere Informationen.
Beispiele
>>> import numpy as np
>>> from scipy.special import logit, expit
>>> logit([0, 0.25, 0.5, 0.75, 1])
array([       -inf, -1.09861229,  0.        ,  1.09861229,         inf])
expitist die Umkehrfunktion vonlogit>>> expit(logit([0.1, 0.75, 0.999])) array([ 0.1 , 0.75 , 0.999])
Plot logit(x) für x in [0, 1]
>>> import matplotlib.pyplot as plt
>>> x = np.linspace(0, 1, 501)
>>> y = logit(x)
>>> plt.plot(x, y)
>>> plt.grid()
>>> plt.ylim(-6, 6)
>>> plt.xlabel('x')
>>> plt.title('logit(x)')
>>> plt.show()