scipy.signal.
square#
- scipy.signal.square(t, duty=0.5)[Quelle]#
Gibt eine periodische Rechteckwellenform zurück.
Die Rechteckwelle hat eine Periode von
2*pi, hat den Wert +1 von 0 bis2*pi*dutyund -1 von2*pi*dutybis2*pi. duty muss im Intervall [0,1] liegen.Beachten Sie, dass dies nicht bandbegrenzt ist. Es erzeugt eine unendliche Anzahl von Harmonischen, die über das gesamte Frequenzspektrum aliased werden.
- Parameter:
- tarray_like
Das Eingabe-Zeit-Array.
- dutyarray_like, optional
Tastverhältnis. Standard ist 0,5 (50 % Tastverhältnis). Wenn es sich um ein Array handelt, ändert sich die Wellenform im Laufe der Zeit, und es muss die gleiche Länge wie t haben.
- Rückgabe:
- yndarray
Ausgabearray, das die Rechteckwellenform enthält.
Beispiele
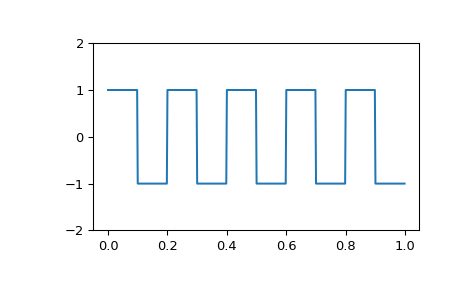
Eine 5-Hz-Wellenform, abgetastet bei 500 Hz für 1 Sekunde
>>> import numpy as np
>>> from scipy import signal
>>> import matplotlib.pyplot as plt
>>> t = np.linspace(0, 1, 500, endpoint=False)
>>> plt.plot(t, signal.square(2 * np.pi * 5 * t))
>>> plt.ylim(-2, 2)
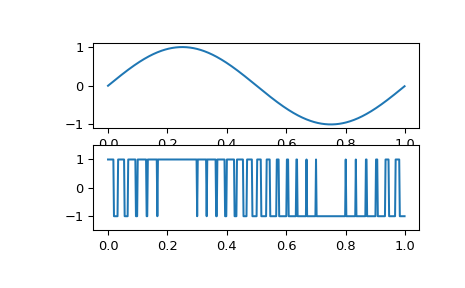
Eine pulsweitenmodulierte Sinuswelle
>>> plt.figure()
>>> sig = np.sin(2 * np.pi * t)
>>> pwm = signal.square(2 * np.pi * 30 * t, duty=(sig + 1)/2)
>>> plt.subplot(2, 1, 1)
>>> plt.plot(t, sig)
>>> plt.subplot(2, 1, 2)
>>> plt.plot(t, pwm)
>>> plt.ylim(-1.5, 1.5)