scipy.spatial.
delaunay_plot_2d#
- scipy.spatial.delaunay_plot_2d(tri, ax=None)[Quelle]#
Zeichnet die gegebene Delaunay-Triangulation in 2D
- Parameter:
- triscipy.spatial.Delaunay-Instanz
Zu zeichnende Triangulation
- axInstanz von matplotlib.axes.Axes, optional
Achsen, auf denen gezeichnet werden soll
- Rückgabe:
- figInstanz von matplotlib.figure.Figure
Figur für die Darstellung
Siehe auch
Hinweise
Benötigt Matplotlib.
Beispiele
>>> import numpy as np
>>> import matplotlib.pyplot as plt
>>> from scipy.spatial import Delaunay, delaunay_plot_2d
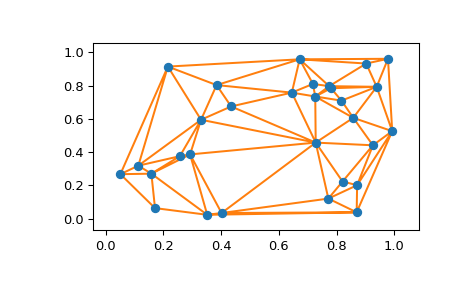
Die Delaunay-Triangulation einer Menge zufälliger Punkte
>>> rng = np.random.default_rng()
>>> points = rng.random((30, 2))
>>> tri = Delaunay(points)
Zeichne sie
>>> _ = delaunay_plot_2d(tri)
>>> plt.show()